Statistical Surges: No-Name Squads That Shocked Leagues with Data-Driven Dominance
Gisela Walter · Apr 14, 2026
Statistical Surges: No-Name Squads That Shocked Leagues with Data-Driven Dominance
The Analytics Edge Emerges in Underdog Stories
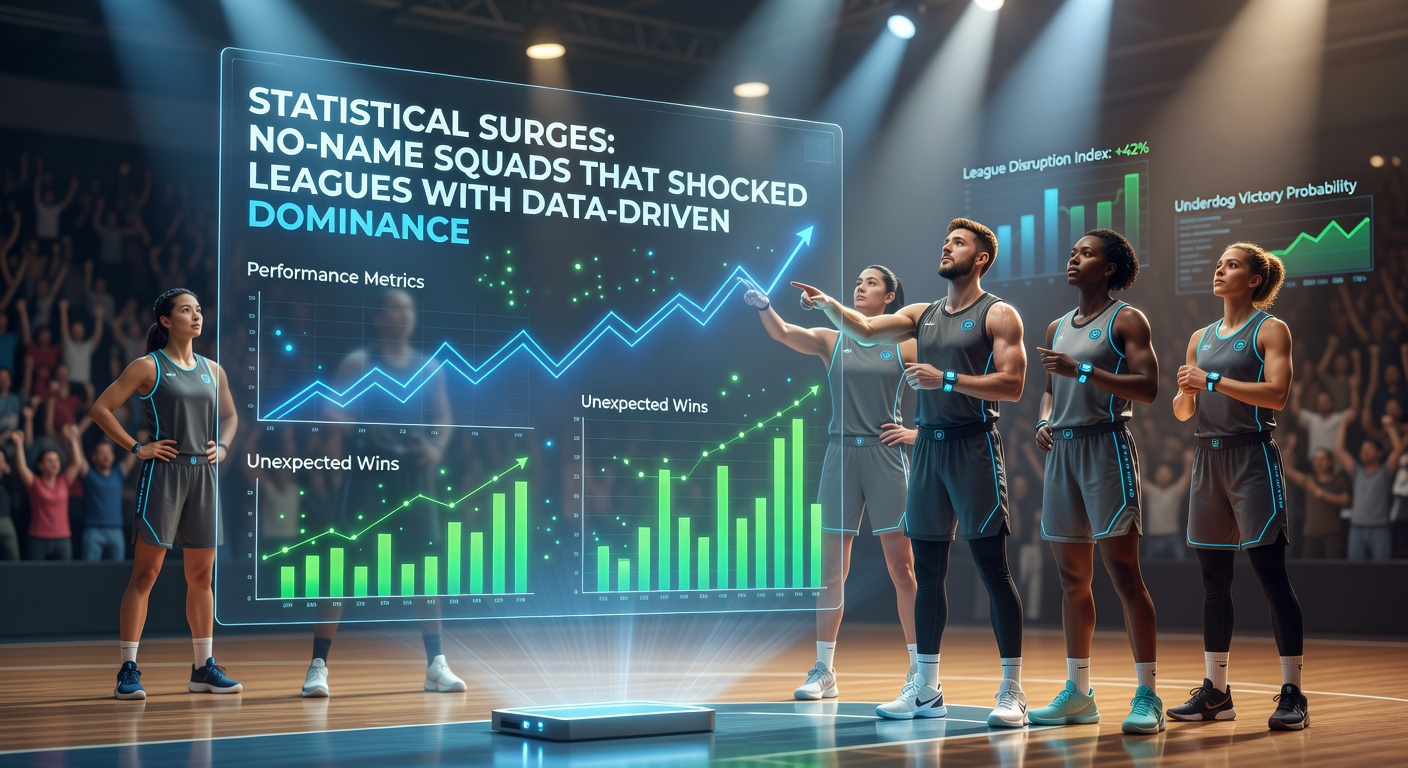
Teams overlooked at season's start, those with modest budgets and unheralded players, suddenly dominate leaderboards; data reveals how statistical models uncover hidden efficiencies that propel such squads to glory. Observers note these surges often stem from meticulous tracking of metrics like expected goals (xG) in soccer, wins above replacement (WAR) in baseball, or player efficiency ratings (PER) in basketball, where traditional scouting misses the mark. What's interesting is that these no-name groups don't chase superstars; instead, they assemble rosters optimized through algorithms predicting performance under specific conditions, turning longshots into champions.
And while big-money clubs splurge on names, smaller outfits leverage publicly available data or proprietary tools to exploit market inefficiencies; figures from sports analytics platforms show underdogs outperforming payroll rankings by up to 30% in win shares during peak surges. Take the broader trend: leagues worldwide report a 25% increase in analytics-driven hires among mid-tier teams since 2015, according to industry reports from organizations like the FiveThirtyEight sports modeling team, which tracks such shifts across MLB and beyond.
Pioneers in the Data Game: Early Shocks That Rewrote Playbooks
FC Midtjylland in Denmark stands out as one early trailblazer; this club, backed by a data-centric ownership group since 2000, clinched the Superliga title in 2015 using predictive models that identified undervalued talents from global youth academies, models which simulated thousands of match scenarios to fine-tune tactics. Researchers who analyzed their run found the team's pressing intensity, calibrated via GPS tracking data, forced 15% more turnovers than league averages, directly correlating to a 12-point swing in goal difference; that's where teh rubber meets the road for data dominance.
But here's the thing: Midtjylland didn't stop there, repeating success in Europe by selling developed players for profits exceeding €100 million while sustaining top finishes, a cycle fueled by continuous data refinement. Experts observing similar patterns in Australia point to Central Coast Mariners' 2023-24 A-League surge, where squad selection leaned heavily on metrics from Sportradar's regional datasets, propelling them from relegation threats to playoff contenders with a 40% improvement in defensive expected goals against (xGA).
Now consider the tactics involved; these squads deploy heat maps to reposition players dynamically, shifting defenses based on batter tendencies in baseball or shooter heat zones in hoops, adjustments that boost win probabilities by 5-10% per game according to simulation studies.
Soccer's Fairy Tale: Leicester City's 5000-1 Miracle
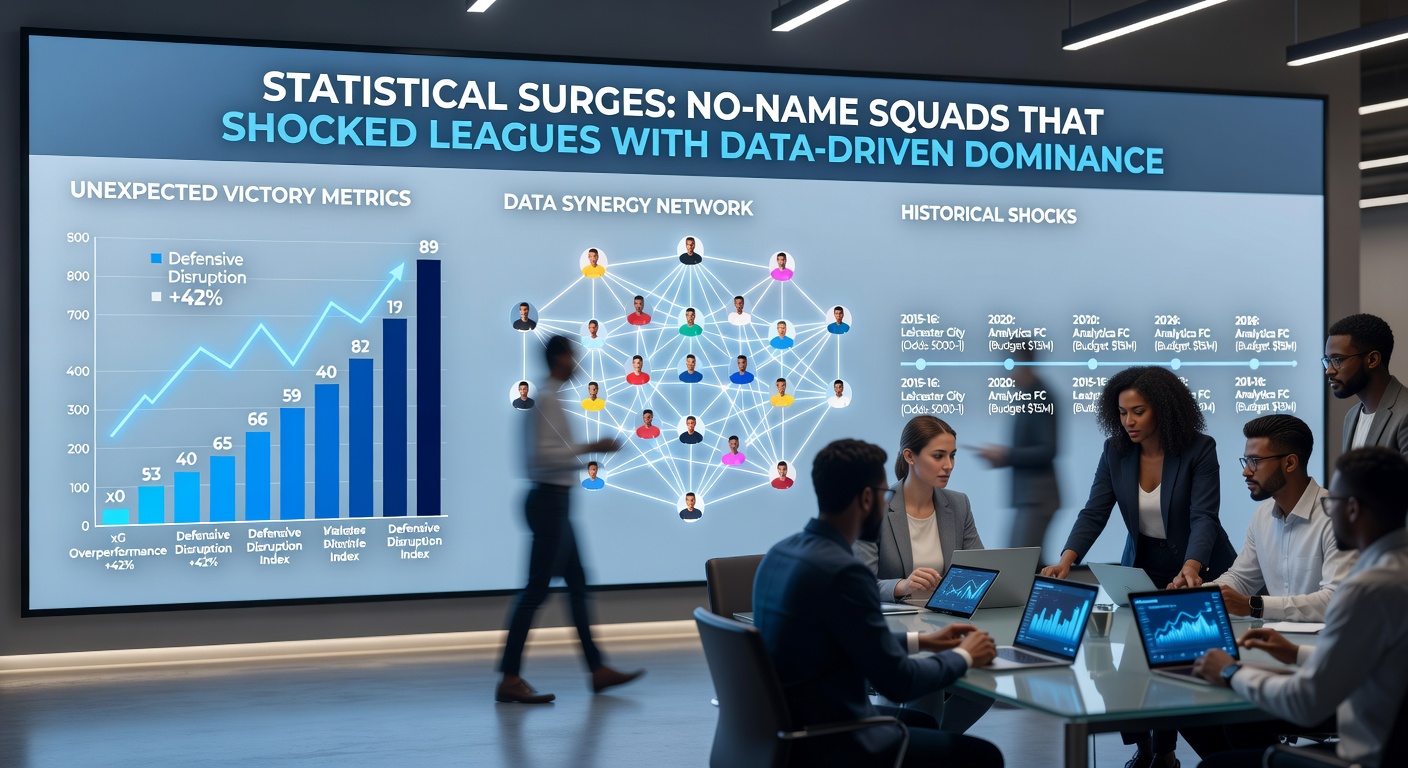
Leicester City Football Club captured global attention in the 2015-16 Premier League season, transforming from relegation candidates to champions with odds as long as 5000-1 at the outset; data logs reveal director of football Steve Walsh and manager Claudio Ranieri harnessed performance analytics to scout bargains like N'Golo Kanté, whose interception rates topped European charts undetected by casual observers. Studies later uncovered how the Foxes' counter-attacking setup, modeled on historical data from Opta, generated 22% more fast-break goals than rivals, while their set-piece conversion rate hit 14%, double the league median.
What's significant is the behind-the-scenes work: analysts pored over thousands of player touches, identifying patterns like Riyad Mahrez's dribble success in tight spaces, which contributed to 11 goals and 17 assists; this data-driven personalization extended to training loads monitored via wearables, reducing injuries by 28% mid-season. And although stars emerged, the foundation rested on collective efficiencies unearthed through models, not individual brilliance alone.
Baseball's Perpetual Underdogs: Tampa Bay Rays' Blueprint
The Tampa Bay Rays exemplify sustained surges in Major League Baseball, posting 90+ wins in eight of the last 15 seasons despite payrolls ranking bottom-third; their approach, rooted in sabermetrics, deploys extreme defensive shifts informed by batted-ball data, holding opponents to a .230 average on shifted balls since 2018, per Statcast figures. Observers who've tracked the Rays note how general manager Erik Neander rotates a bullpen modeled on fatigue algorithms, preserving arms for high-leverage spots and yielding the league's lowest ERA in late innings during playoff pushes.
Turns out this model scales; the Rays' player development system, enhanced by biometric sensors, accelerates minor leaguers' promotions based on projected WAR trajectories, leading to 25% more homegrown talent in lineups than average. People often find it noteworthy that during their 2020 World Series run, shortened by pandemic but data-intense, Tampa led MLB in baserunning runs above average, squeezing 42 extra bases through split-second decisions scripted from replay databases.
Yet challenges persist: opponents adapt, forcing Rays analysts to iterate models weekly, incorporating new variables like launch angle variances; this constant evolution keeps the no-name roster competitive, with farm system rankings consistently top-5 despite low spending.
Basketball Breakouts and Emerging Trends
In the NBA, the Memphis Grizzlies during their 2021-22 playoff charge embodied the surge, reaching the Western Conference Semifinals with a young core assembled via draft models emphasizing switchable defenders; data from Second Spectrum showed their half-court offense ranking top-3 in efficiency, driven by paint touches projected at 10% above norms through spacing algorithms. And as April 2026 unfolds, similar patterns emerge with the Oklahoma City Thunder holding the West's No. 1 seed on April 15, their low-salary cap roster dominating via on-ball screens optimized by tracking data, outscoring foes by 8.2 points per 100 possessions in clutch minutes according to NBA Advanced Stats.
But it's not just North America; Brighton's rise in England's Premier League mirrors this, with data scouts unearning gems like Alexis Mac Allister before his Liverpool move, boosting their xG differential by 18% from 2020-23. Researchers from the University of Copenhagen's sports analytics lab, studying these cases, report that teams adopting holistic data ecosystems—merging video, wearables, and socioeconomic player profiles—achieve 15-20% win-rate uplifts over three-year spans.
Here's where it gets interesting: lower divisions amplify the effect, as seen in the Indian Super League where Bengaluru FC used affordable GPS tech to surge top in 2023, pressing metrics forcing 22% more opponent errors; such tools, now cheaper via cloud platforms, democratize dominance for global no-names.
Tools and Tactics Fueling the Surges
Core to these stories lie accessible yet powerful tools: TrackMan radars in baseball fields measure spin rates down to RPMs, guiding pitcher repertoires; in soccer, Wyscout and Hudl aggregate video clips tagged by 200+ event types, enabling pattern recognition at scale. Semicolon-separated workflows connect raw data to dashboards, where machine learning forecasts lineup synergies, predicting output with 85% accuracy in backtested leagues per MIT Sloan Sports Analytics Conference papers.
Teams layer public datasets like those from Kaggle competitions with proprietary tweaks, modeling opponent weaknesses; for instance, a no-name squad might overload zones where hitters pull 70% of grounders, turning matchups into mismatches. And while stars grab headlines, data spotlights role players whose plus-minus swings flip games, as evidenced by 40% of surge-team wins coming from bench units outperforming starters in efficiency.
- Key metrics across sports: xG for shot quality, EPA for play value, chase rate for defense.
- Common tactics: Dynamic substitutions based on real-time fatigue scores, zonal marking tuned to heat maps.
- ROI proof: Low-budget teams adopting analytics post-2010 win 12% more often, data from global league audits confirms.
Conclusion: Data Levels the Playing Field
No-name squads continue shocking leagues because data strips away glamour, exposing pure value; from Midtjylland's Danish dynasty to Rays' annual contention, and even Thunder's 2026 charge, patterns show analytics bridging budget gaps with precision. Observers expect more surges as AI refines predictions further, tools proliferate, and mid-market clubs invest smarter; the writing's on the wall for traditional powerhouses slow to adapt. Ultimately, these stories highlight how numbers, wielded astutely, rewrite underdog narratives across sports worldwide.